


The best Datadog alternatives & competitors, compared

Contents
A lot of engineers have that dog in them, but not every company wants that Datadog in them.
Datadog is one of the most widely-used observability and monitoring tools on the market, and for good reason. It's mature and has nearly all the observability tools engineers might want.
But Datadog isn't the only option. Whether you're looking for a stronger product focus, a simpler setup, or just a cheaper alternative, there are plenty of options out there.
In this guide, we compare the best Datadog alternatives, including tools that go beyond traditional observability tools to help you understand who is affected and why it matters – not just what broke.
1. New Relic
- Founded: 2008
- Similar to: Datadog, Dynatrace
- Typical users: Engineers, DevOps, SREs, and IT Ops
- Typical customers: Enterprises, mid-market technology companies, and cloud-native organizations
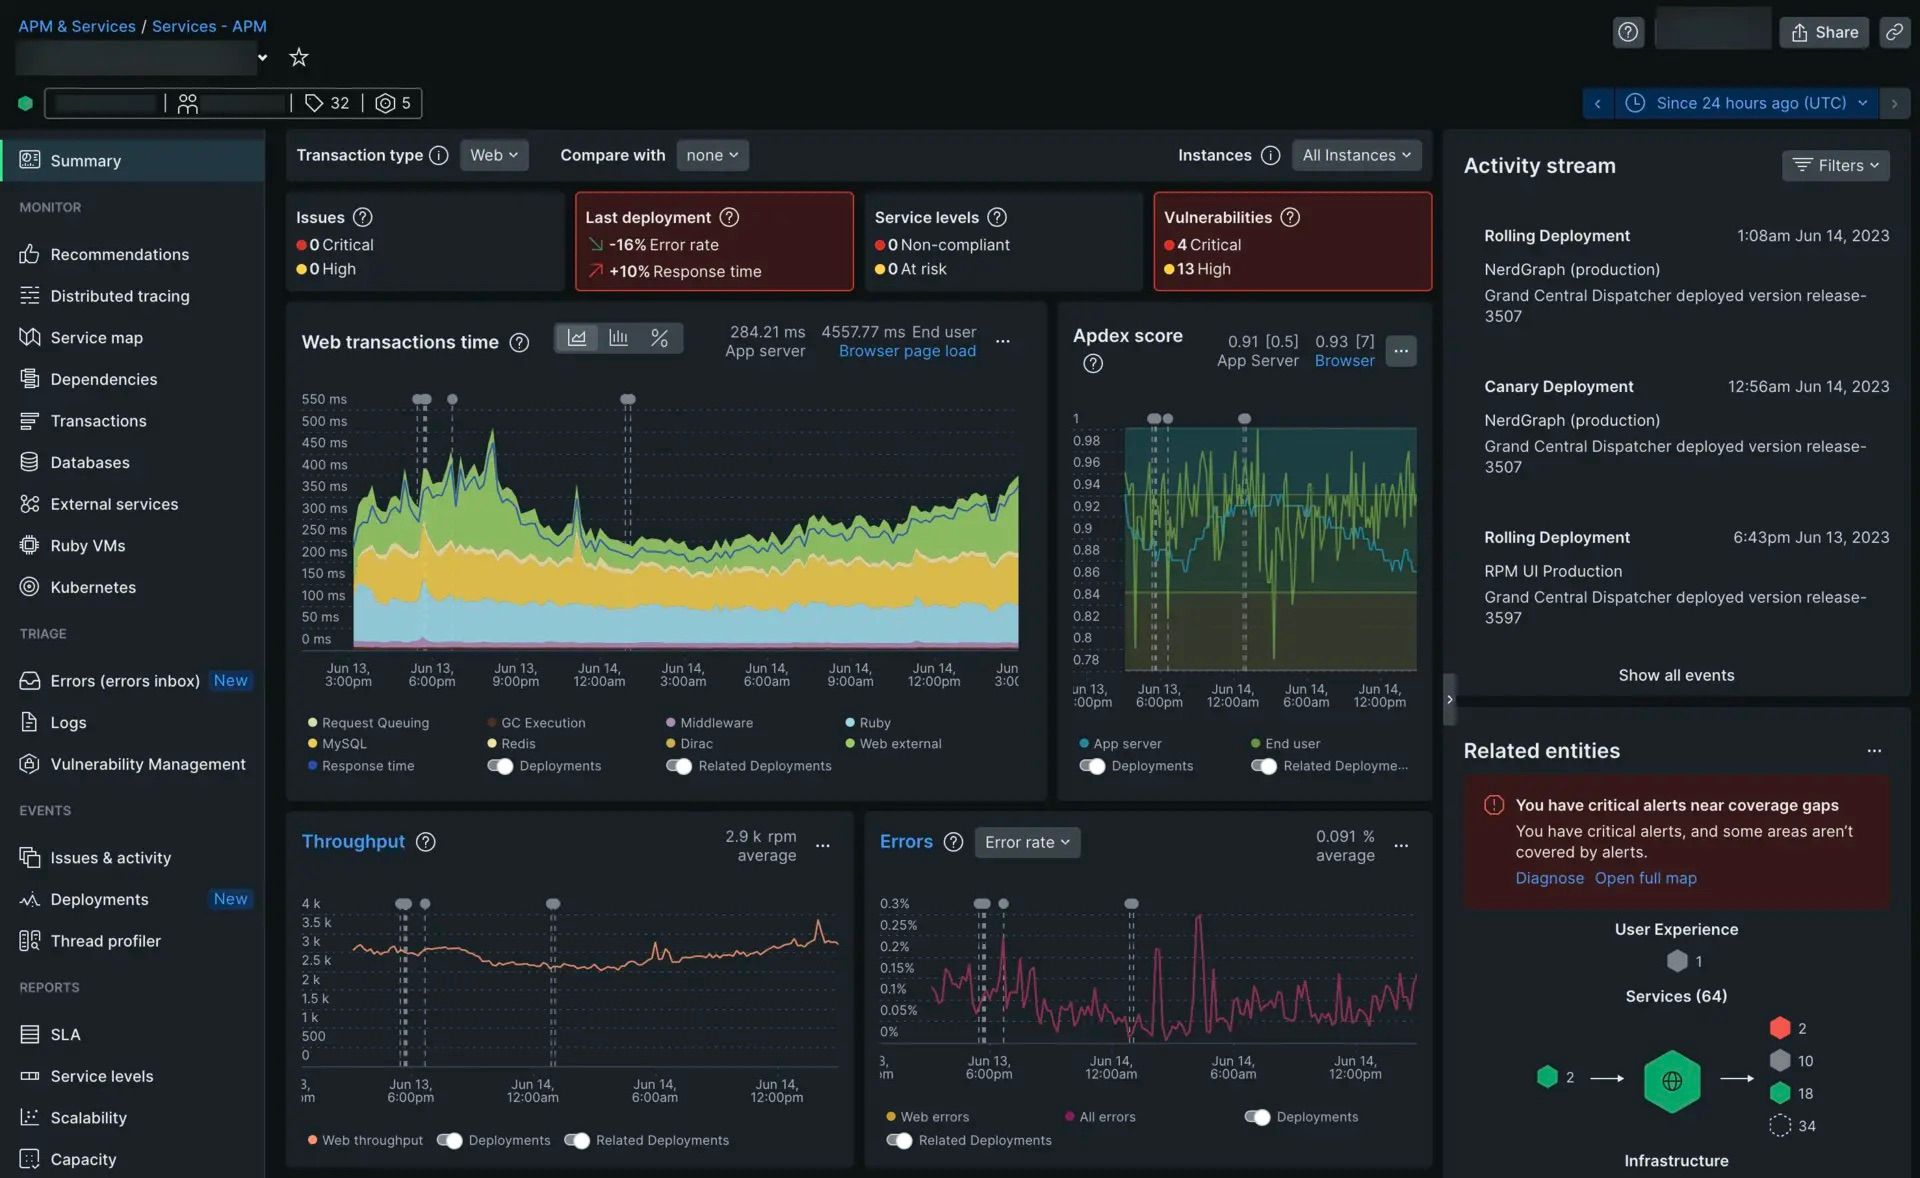
What is New Relic?
New Relic is a cloud-based observability and analytics platform that provides full-stack visibility into application performance, infrastructure, and user experience. It helps organizations monitor, troubleshoot, and optimize their software in real time, enabling proactive issue resolution and improved customer experiences.
Key features
Application performance monitoring: Get a full stack view of your application health and debug faster with a unified visibility.
Infrastructure monitoring: Get visibility into cloud infrastructure, Kubernetes, databases, networks, serverless, and more.
Log management: Aggregate and analyze logs with distributed tracing for quick troubleshooting.
Integrations: Connect with over 780 tools and open source ecosystems
Flexible pricing: Usage-based pricing model with a free tier, makes it cheaper to get started with (than Datadog)
How does New Relic compare to Datadog?
Main differences between New Relic and Datadog
New Relic offers a simple usage-based pricing model. It's $0.40/GB ingested with 100 GB/month free. Datadog has per product pricing, which causes costs to escalate unpredictably.
New Relic focuses more on application performance monitoring and full stack observability. Datadog has an expanded focus with infrastructure monitoring, security, and compliance.
Although New Relic has IAST, it doesn't have nearly as many code and cloud security features as Datadog.
Datadog has software delivery features like CI visibility, feature flags, and code coverage that New Relic doesn't.
New Relic claims that Datadog's monitoring suite is "siloed" with separate telemetry platforms while theirs provides a single, unified experience.
Main similarities between New Relic and Datadog
Both have a strong focus on AI. Datadog's homepage tagline is "AI-Powered Observability and Security," while New Relic's is "Maximize business uptime and drive engineering excellence in the AI era."
Both are mature observability and monitoring platforms with APM, experience monitoring, logs, and infrastructure monitoring products.
Both have relatively transparent, usage-based pricing, although New Relic's is more straightforward.
Both primarily serve engineers, DevOps, SREs, and platform teams at cloud-native companies and enterprises.
Why do companies use New Relic?
G2 reviewers like New Relic because:
It's all-in-one: New Relic provides all the functionality reviewers need to monitor their apps and infrastructure, as well as find issues and solve them.
It's easy to get started: New Relic is easy to set up and its pre-built queries and dashboards help reviewers get started quickly and transition into more complex use cases when needed.
Flexibility: Thanks to New Relic's extensive list of integrations, it's easy to connect New Relic to nearly every tool they use. Reviewers also appreciate that NRQL lets them write custom queries to get the data they need.
Bottom line
New Relic is similar to Datadog: it has a ton of observability and monitoring features (along with the added bonus of a free tier). Definitely one to consider for enterprise DevOps and SRE teams.
2. Dynatrace
- Founded: 2005
- Similar to: Datadog, New Relic
- Typical users: DevOps engineers, SREs, and IT operations teams.
- Typical customers: Enterprises in financial services, healthcare, retail, and the public sector.
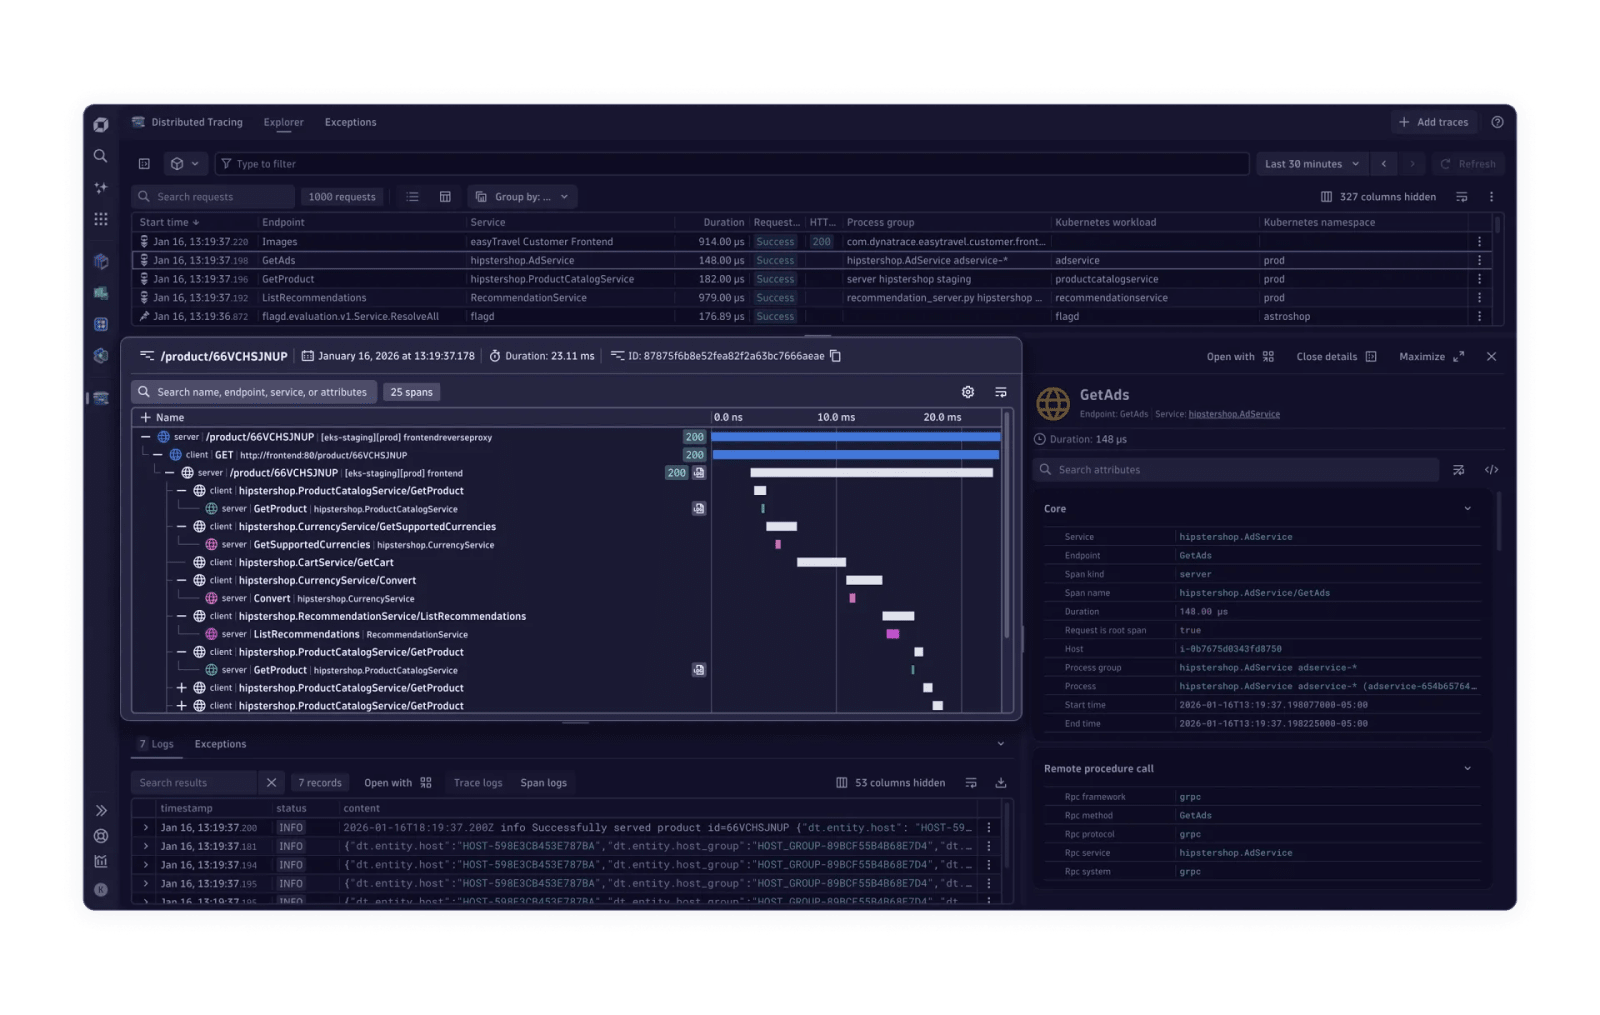
What is Dynatrace?
Dynatrace is another comprehensive observability and monitoring platform that provides infrastructure, application, AI, and business observability. They also provide products for digital experience, logs, security, and software delivery.
They also offer a unified platform for data, AI-powered insights, and transparent pricing.
Key features
Infrastructure observability: End-to-end visibility into your hybrid and cloud infrastructure with continuous discovery and visualization of dynamic hosts.
Application observability: Complete visibility into services, clouds, and containers while connecting to traces, metrics, logs, and exceptions in context.
Digital experience: Frontend, backend, and mobile digital experience monitoring with real user monitoring, session replay, and synthetic monitoring.
Log management and analytics: Ingest, search, and analyze logs with all the context you need to troubleshoot issues.
AI-powered: Agents and AI insights to predict, automate, prevent, and fix issues.
How does Dynatrace compare to Datadog?
Main differences between Dynatrace and Datadog
Dynatrace's OneAgent auto-discovers your entire stack with minimal setup. Datadog requires per-technology agent configs, giving more control but demanding more effort.
Dynatrace has application security and threat observability features, but Datadog has more cloud security features.
Although Dynatrace has a 15 day free trial, it doesn't have a free tier like Datadog has for some products.
Dynatrace (like New Relic) claims that Datadog has multiple data silos disconnecting their monitoring products while theirs provides a single, unified experience.
Main similarities between Dynatrace and Datadog
Both are full-stack observability platforms with infrastructure, application, logs, and experience monitoring products.
Both have real user monitoring and session replay to help you understand user behavior and troubleshoot issues.
Both are popular with enterprises and large organizations, and have focused more on AI-powered insights and automation recently.
Both have transparent, usage-based, product-based pricing.
Why do companies use Dynatrace?
According to G2, reviewers are fans of Dynatrace because:
AI-powered insights: Reviewers praise Dynatrace's AI-powered monitoring and observability as it helps them detect anomalies and find the root cause of issues fast.
Ease of deployment: Dynatrace's integrations and their auto-discovery feature makes it easier for reviewers to understand their infrastructure and troubleshoot issues.
Comprehensive: Dynatrace provides a comprehensive observability platform with the infrastructure, application, logs, and experience monitoring products reviewers need.
Bottom line
Dynatrace is very similar to both Datadog and New Relic, making it a solid alternative for enterprises who want a comprehensive observability platform with a strong focus on AI and a different pricing model.
3. SigNoz
- Founded: 2021
- Similar to: Better Stack
- Typical users: Backend and devops engineers
- Typical customers: Developer-led teams who prefer self-hosting
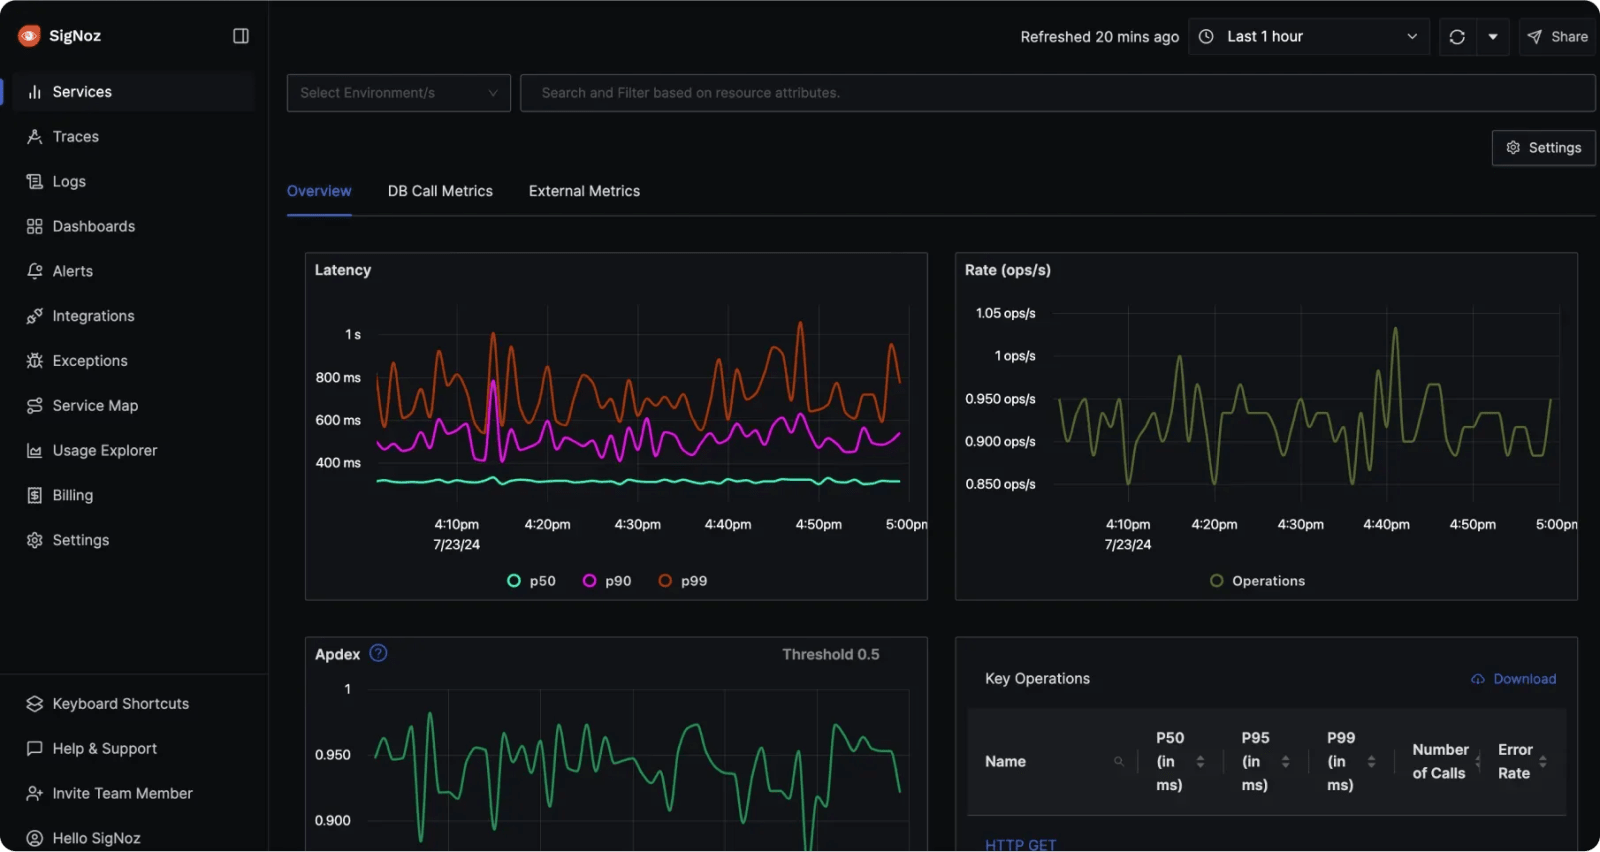
What is SigNoz?
SigNoz is an open-source observability platform built on OpenTelemetry.
It collects metrics, traces, and errors into one open-source platform designed to replace proprietary APM tools like Datadog or New Relic. It's self-hostable, cost-effective, and ideal for teams standardizing on open telemetry stacks.
Key features
Application performance monitoring: Monitor and troubleshoot your application. Track requests across services and identify bottlenecks with distributed tracing.
Log management: Ingest, search, and analyze logs with added context from traces and metrics.
Infrastructure monitoring: Get a view into host and Kubernetes performance, traces, and logs.
Open source: SigNoz is open source under the Apache 2.0 license, with 24k+ stars and a rapidly growing contributor base.
OTEL-native: Built on OpenTelemetry and one of the most active projects in the ecosystem. SigNoz supports all OTEL SDKs and data formats.
How does SigNoz compare to Datadog?
Main differences between SigNoz and Datadog
SigNoz is open source under the Apache 2.0 license, while Datadog is closed source.
SigNoz was built around OpenTelemetry, while Datadog supports OTEL, but largely pushes its own proprietary formats.
SigNoz only charges for logs, traces, and metrics. Datadog has many more products and charges for each one, but some have a free tier. SigNoz does not have a free tier for any of its products.
While SigNoz is an observability platform, Datadog goes far beyond that with security, compliance, and governance features.
Datadog has a much stronger focus on AI-powered insights and automation.
Main similarities between SigNoz and Datadog
Both are observability platforms with application performance monitoring, log management, and infrastructure monitoring products.
On top of that, both have LLM observability and error tracking products.
Both offer cloud-hosted and self-managed options, although SigNoz is open source and self-hostable.
Both have transparent, usage-based pricing.
Why do companies use SigNoz?
SigNoz doesn't have a G2 page, but based on Reddit discussions, companies use SigNoz because:
Easy to get started: Thanks to its OpenTelemetry-native design and good defaults, reviewers say it's easy to get started with. They also mention that it can automatically ingest k8s pod logs and metrics without additional setup.
Open source and self-hostable: Reviewers like that they can fully control their data and infrastructure by self-hosting SigNoz.
Community: The SigNoz team actively responds to feedback and helps fix issues quickly.
Bottom line
SigNoz may not have as many features as Datadog, but the combination of simpler pricing, being open source, and being OTEL-native makes it a strong alternative for medium-sized teams and companies.
4. Grafana
- Founded: 2014
- Similar to: Elastic
- Typical users: DevOps, SRE, platform engineers
- Typical customers: Mid-to-large engineering organizations
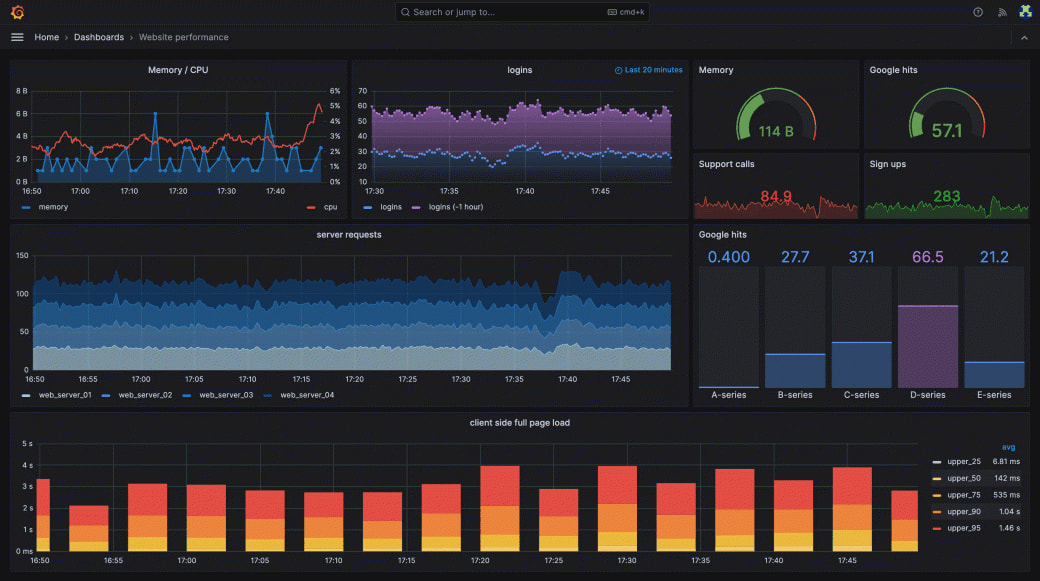
What is Grafana?
Grafana is an open source observability platform that centralizes metrics, logs, traces, and profiles. It provides observability for big infrastructure providers, monitoring for popular services, and connectors for other tools.
Once all this data is captured or connected, Grafana provides over 100 data visualization options to build all sorts of dashboards. It also provides more tools for making use of this data like alerts, transformations, and annotations.
Key features
Logs: A fully managed log aggregation system powered (named Loki) that allows you to store and query logs from all your applications and infrastructure.
Visualizations: Query, visualize, alert on, and understand your data no matter where it's stored. Create, explore, and share your data through beautiful, flexible dashboards.
Metrics: Highly scalable metrics ingestion that enables you to identify and troubleshoot issues quickly. Also enables cardinality optimization to keep costs in control.
Traces: Distributed tracing to understand the flow of requests across your services and find issues fast.
Incident response: Create alerts and SLOs then manage on-call and incident response, all with the context of your observability data.
How does Grafana compare to Datadog?
Main differences between Grafana and Datadog
Grafana is open source (AGPLv3) and self-hostable, while Datadog is closed source and cloud-only.
The core of Grafana is the visualization layer which enables you to assemble your own stack. Datadog is an all-in-one platform that provides all the tools you need, wants you to use them all.
Grafana can pull data from many sources, while Datadog only pulls data from Datadog's system. Both have integrations, but Grafana is more flexible in what it can connect to.
Datadog has a broader portfolio of product that includes security, compliance, and governance features, while Grafana is focused on observability.
Main similarities between Grafana and Datadog
Both have transparent, usage-based, per-product pricing as well as a free hosted version.
Both have strong logging, metrics, tracing, and visualization products along with integrations with the most popular tools and services.
Both have AI assistants to help you troubleshoot issues, investigating incidents, and get insights from your data.
Both have unified alerting and incident response features.
Why do companies use Grafana?
Based on reviews from G2, people use Grafana because:
Visualizations: Reviewers praise Grafana's visualizations, dashboards, and the customizability they provide. They also mention it's much more intuitive than other tools.
Open source: Reviewers appreciate that Grafana is open source and self-hostable. Their dedication to transparency is a big selling point for some.
Flexibility: Reviewers like that Grafana can pull data from many sources and create many types of visualizations and alerts to fit their needs.
Bottom line
Grafana is a great alternative to Datadog for teams who want a flexible, open source, and self-hostable observability platform with a strong focus on visualization and customizability.
5. Elastic
- Founded: 2012
- Similar to: Grafana
- Typical users: SREs, platform engineers, security analysts
- Typical customers: Mid-to-large enterprises with high data volumes and strict regulatory environments

What is Elastic?
Elastic is a search and analytics engine that provides a unified platform for logging, metrics, tracing, and visualization. It's built on the Elasticsearch and Kibana projects, which are both open source.
Elasticsearch was originally released in 2010 under an open-source license, but has expanded well beyond just search now to include log management, infrastructure monitoring, digital experience monitoring, and more
Key features
Log analytics: Ingest, search, categorize, and analyze logs to get a clearer picture of patterns and anomalies.
Application and infrastructure monitoring: Ingest OTel data or use agents to collect observability data from anywhere and find issues faster.
Digital experience: Monitor critical journeys, capture user sessions, and track SLOs to ensure the best possible user experience.
Security and SIEM: Detect threats, triage alerts, use AI to discover attacks, and respond faster with the context of your observability data.
How does Elastic compare to Datadog?
Main differences between Elastic and Datadog
Elastic is open source under the Elastic License and can be self-hosted, while Datadog is closed source and cloud-only.
Although Elastic lists prices on their site, they only show the minimums and it's unclear how it scales. Datadog has more transparent pricing with usage-based pricing.
Because of its flexibility, Elastic requires more configuration to set up, especially if self-hosting. Datadog is more opinionated and structured, making it easier to get started.
Elastic also has a search product that enables companies to add search to their product for employees and customers. Datadog does not have a search product.
Main similarities between Elastic and Datadog
Both are mature, multi-product companies with full-stack observability products along with enterprise-grade security and compliance features.
Both have legit security product offerings including SIEM, cloud security, and more.
Both have a significant focus on AI, both in terms of an AI assistant for tasks and insights as well as LLM observability.
Both have a lot of integrations with popular tools and services as well as support for OpenTelemetry data formats.
Why do companies use Elastic?
G2 reviewers praise Elastic for:
Ease of use: Reviewers mention how Elastic simplifies log management and data visualization. They say it has strong out-of-the-box options which helps too.
Performance: Elastic is designed to scale, handle real time logs, and ingest massive amounts of data. This helps reviewers debug fast and always have the right data available.
Flexibility: Both Elastic's observability and security products are praised by reviewers for their flexibility in connecting with many tools while still giving the depth they need.
Bottom line
If you're looking for an enterprise-tier product focused on observability and security, Elastic is a great alternative to Datadog.
6. Better Stack
- Founded: 2021
- Similar to: SigNoz
- Typical users: DevOps, SRE, backend engineers
- Typical customers: SMB to mid-market SaaS companies
What is Better Stack?
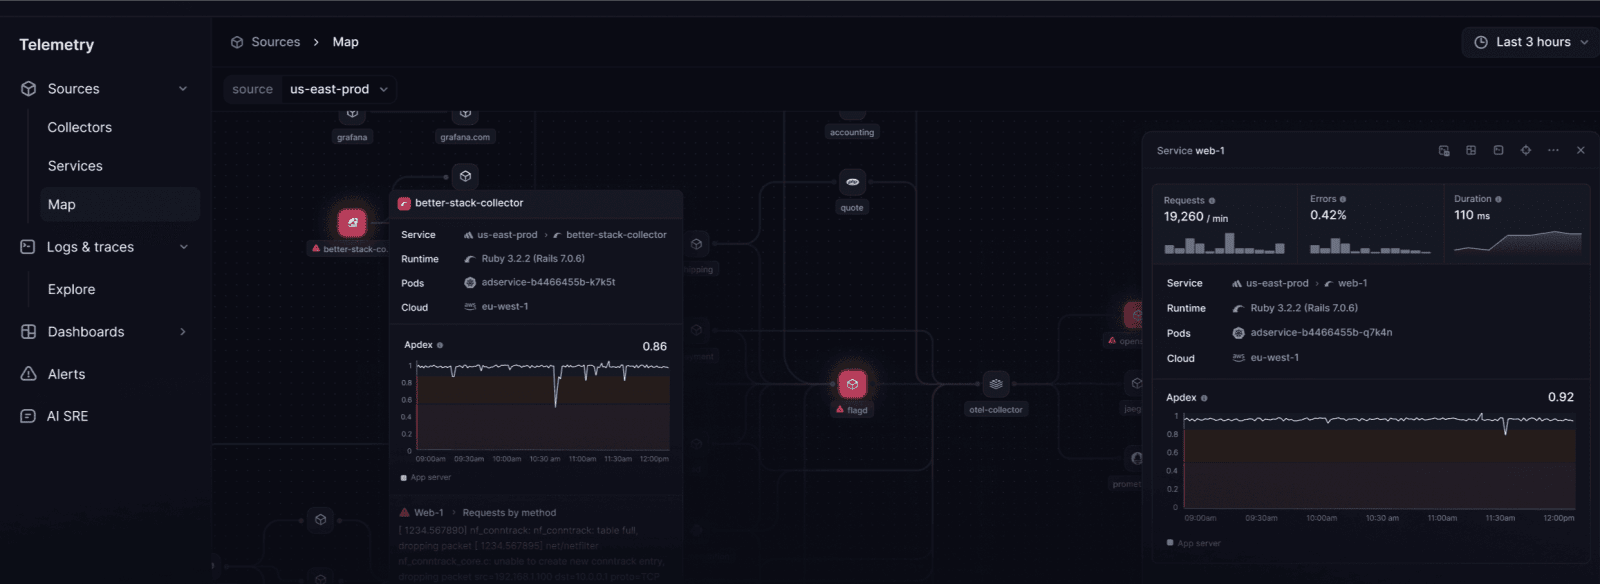
Better Stack is an observability platform that provides logs, tracing, infrastructure monitoring. It also includes error tracking, incident management, uptime monitoring, and status pages.
Its key selling point is that it is a fraction of the cost of Datadog. It says "30x cheaper than Datadog" on their homepage.
Key features
Logs and traces: OpenTelemetry-native logging and tracing that uses eBPF to instrument clusters without code changes.
Incident management: AI-native incident management with on-call, status pages, escalation policies, and workflows.
Error tracking: Sentry-compatible error tracking with stack traces, breadcrumbs, releases, and alerts.
Uptime monitoring: Monitor pages and get alerts with a screenshot of the error and a second-by-second timeline.
How does Better Stack compare to Datadog?
Main differences between Better Stack and Datadog
For the products they do offer, Better Stack is cheaper than Datadog. By their calculation, 1 TB of traces, logs, and metrics would cost $687 per month on Better Stack vs $55,574 per month on Datadog.
Although Better Stack has some products beyond observability, Datadog has a much broader portfolio of products including security, digital experience, and software delivery features.
Datadog focuses on enterprise-grade features (and customers) while Better Stack is more focused on smaller teams and startups.
Main similarities between Better Stack and Datadog
Both feature the core observability products like logs, traces, and metrics as well as an AI assistant for each.
Both include incident management, uptime monitoring, status pages, and error tracking.
Both have transparent, usage-based pricing as well as a free tier.
Why do companies use Better Stack?
Here's what G2 reviewers like about Better Stack:
Ease of use: Reviewers like Better Stack's simpler interface as well as how easy it is to get started. One mentioned they were up and running in 5 minutes.
Free tier: Reviewers mention that Better Stack's free tier is actually useful. They mention it's great for smaller teams and projects.
Design: Reviewers mention that Better Stack has some of the best visual design in the industry, making it easy to use and navigate.
Bottom line
For smaller teams, especially startups, Better Stack is a great alternative to Datadog thanks to their free tier, transparent pricing, and simplicity.
7. PostHog
- Founded: 2020
- Similar to: Better Stack, Datadog
- Typical users: Engineers and product teams
- Typical customers: Mid-size B2Bs and startups


What is PostHog?
PostHog (that's us 👋) is an all-in-one platform combining logs, error tracking, session replays, product analytics, A/B testing, feature flags, user surveys, LLM observability, and more into one product.
This means it's not only an alternative to Datadog but also tools like Amplitude, Sentry, and LaunchDarkly.
Key features
Logs: Filter, aggregate, and explore logs by attributes instead of scrolling text and combine with all the rest of your analytics data. Works with OpenTelemetry data.
Error tracking: Capture errors and exceptions. Provide stack traces to debug issues. Correlate with product usage data.
Session replays: View exactly how users are using your site. Includes event timelines, console logs, network activity, performance monitoring, and 90-day data retention.
Product analytics: Custom trends, funnels, user paths, retention analysis, and segment user cohorts. Also, direct SQL querying for power users.
Feature flags: Rollout features safely with local evaluation (for faster performance), JSON payloads, and instant rollbacks.
LLM observability: Track AI product usage, monitor model performance, analyze token costs, and debug LLM interactions.
How does PostHog compare to Datadog?
Main differences between PostHog and Datadog
PostHog is not a complete observability platform (yet). It includes logs, but no APM, cloud monitoring, or other monitoring features. PostHog focuses more on user experience products.
PostHog offers a generous free tier for its products including 100k errors, 50GB of logs, 1M analytics events, 5k session replays, and more. Datadog has a free tier for some products, but not all (like logs, error tracking, or product analytics).
All PostHog products tie together with shared data models. Datadog's products are much more siloed.
Datadog offers many security and service management features that PostHog does not.
Main similarities between PostHog and Datadog
Both include important DevOps features like logs, error tracking, performance monitoring, and more.
Beyond these, they both offer "digital experience" products like product analytics, session replays, and real user monitoring. They both also have feature flags.
Both have a strong focus on AI. They have AI assistants for querying and analyzing data as well as LLM observability to track AI product usage.
Both are multi-product companies with transparent, usage-based pricing.
Why do companies use PostHog?
According to reviews on G2, companies use PostHog because:
It replaces multiple tools: PostHog can replace Mixpanel (product analytics), Fullstory (session replay), and Optimizely (feature flags and A/B testing). This simplifies workflows and ensures product data is all in one place.
Pricing is transparent and scalable: Reviewers appreciate how PostHog's pricing scales as they grow. There's a generous free tier they can use forever. Companies eligible for PostHog for Startups also get $50k in additional free credits.
They need a complete picture of users: PostHog includes every tool necessary to understand users and improve products. This means creating funnels to track conversion, watching replays to see where users get stuck, testing solutions with A/B tests, gathering feedback with user surveys, and monitoring errors.
Bottom line
If you're looking for logs, error tracking, and session replay, along with many more tools for making your product better, PostHog is a great alternative to Datadog. This is especially the case for startups and scale ups, thanks to PostHog's generous free tier.
Which Datadog alternative should you choose?
- Want a complete, enterprise-scale observability platform with deep integrations? New Relic is one of the top choices.
- Need unified dashboards, open source flexibility, and powerful visualizations? Grafana stands out here.
- Looking for a search-first platform that unifies logging, metrics, and traces? Elastic is worth a look.
- Prefer AI-powered infrastructure monitoring with simpler agent setup? Dynatrace makes deployment easy.
- Want an affordable, OpenTelemetry-native solution for logs and traces? Try SigNoz.
- Looking for a cheap observability option with error tracking and incident management for startups? Check out Better Stack.
- Want an all-in-one platform that connects logs and errors to user sessions, analytics, feature flags, LLM observability, and more? Go with PostHog.
Is PostHog right for you?
Here's the (short) sales pitch.
We're biased, obviously, but we think PostHog is the perfect Datadog replacement if:
- You value transparency. We're open source and open core.
- You want all the tools to help you build a better product (like product analytics, session replays, and A/B testing).
- You want to try before you buy. We're self-serve with a generous free tier.
Check out logs install guide and read our docs to learn more.
Frequently asked questions
What is Datadog used for?
Datadog is used by engineering and DevOps teams to gain visibility, understand, and respond to issues across their applications and infrastructure.
Why look for Datadog alternatives?
Common reasons include: complicated billing growing rapidly and unpredictably, wanting more predictable and transparent pricing, needing complete control over your data (self-hosting), avoiding vendor lock-in, and improving data usability by avoiding silos.
What's the best Datadog alternative overall?
For most teams, New Relic is the closest like-for-like alternative to Datadog, covering APM, infrastructure monitoring, logs, and metrics. It also has a generous free tier.
Which Datadog alternatives are open source?
PostHog is fully open source under the MIT license with a public roadmap. SigNoz, Grafana, and Elastic are also open source and offer self-hosting.
Which Datadog alternative has the best free tier?
PostHog offers 50GB of logs, 100k errors, 1M analytics events, 5k session replays, and unlimited team members. New Relic offers 100 GB/month of data ingest.
Which Datadog alternative is best for frontend debugging?
PostHog offers session replay with error correlation and performance monitoring, plus broader product analytics capabilities.
Which Datadog alternative is best for enterprise observability?
Dynatrace and New Relic are built for enterprise-scale observability, covering infrastructure, APM, logs, and metrics across your entire stack. Both can get expensive at scale, but offer deep visibility into complex systems.
PostHog is an all-in-one developer platform for building successful products. We provide product analytics, web analytics, session replay, error tracking, feature flags, experiments, surveys, LLM analytics, logs, workflows, endpoints, data warehouse, CDP, and an AI product assistant to help debug your code, ship features faster, and keep all your usage and customer data in one stack.